
BRIEFING:
Benefit Sanctions Statistics:
JSA, ESA, Universal Credit and Income Support for Lone Parents
August 2017
22 September 2017
Dr David Webster
Honorary Senior Research Fellow
Urban Studies
University of Glasgow
Webpages: http://www.gla.ac.uk/schools/socialpolitical/staff/davidwebster/
http://www.cpag.org.uk/david-webster
SUMMARY
In the year to March 2017 there were approximately 129,000 JSA and 229,000 UC sanctions on unemployed people before challenges, a total of 358,000. This is an increase over the revised figure of 328,000 for calendar 2016. Over the period August 2015 to March 2017, the rate of UC sanctions was 7.4% of claimants per month. This is three times the rate of 2.5% for JSA. It makes the overall rate 3.8% for JSA and UC combined. Because of DWP backlogs, at present it is impossible to say whether there is a trend in the UC sanction rate, but the overall rate of sanction on unemployed people is likely to rise simply because of the continuing transfer of claimants to the high-sanctioning UC. The UC sanction rate is higher than JSA for every age group, by amounts varying from 58% to 122%.
DWP has published new figures for the proportion of UC and ESA claimants who were under sanction at a point in time. For UC this proportion is stated to have varied between 3.0% and 5.4%. However the correct figures are approximately 6.7% to 12.0%. New figures are also published for the duration of UC and ESA sanctions. The median UC sanction length is shown as 31 days, but after allowing for repayments of hardship payments the true median would be about 52 days, or over 7 weeks.
New calculations in this Briefing show the number of JSA suspensions each month which have not been followed by a sanction. These must be added to the number of JSA sanctions overturned following challenge to give the total of cases where JSA has been wrongfully stopped. There are now only a couple of hundred JSA suspensions per month, but they rose to a peak of 9,000 per month in 2013, increasing the total of wrongful JSA stoppages by 82%. Altogether, since May 2010 there have been 317,100 abortive JSA suspensions.
Official statistics released on 14 September show that the take-up of income-based JSA has fallen from 69% in 2009/10 to 56% in 2015/16; sanctions policy has been successful in driving people off benefit but at the same time it has taken them beyond the reach of government employment schemes.
The ESA sanction rate is stable at 0.32% per month before challenges. The new figures on duration show that by the end of 2016, one quarter of completed ESA sanctions were lasting more than three months and 16% for more than six months; the latter proportion is far higher than for UC, although all of these ESA claimants were sick or disabled. DWP has now added to Stat-Xplore the medical condition which is the principal reason for each ESA claim. Over the period July 2011 to March 2017, of the big groups, ‘mental and behavioural’ had the highest rate of sanction, followed by ‘respiratory’, ‘injury and poisoning’, a general ‘other’ group, ‘nervous system’, ‘musculoskeletal’ and ‘circulatory’. There are particularly high sanction rates for investigations and procedures and for pregnant women. Since mid-2015 the previous very large excess of the sanction rate for people with mental and behavioural conditions compared to other groups appears to have been eliminated. This suggests that DWP has made some progress in its treatment of people with these conditions.
The DWP’s response of 6 April to the letter from the UK Statistics Authority asking about progress in improving the sanctions statistics leaves it far short of compliance with the requirements of the UKSA. The Briefing has a detailed assessment of the position. Readers have the opportunity to respond to a DWP consultation on Universal Credit statistics, closing on 24 October. At the end of the Briefing there is also information about other developments relating to the sanctions regime. BRIEFING: Benefit Sanctions StatisticsAugust 2017
INTRODUCTION
This briefing continues the series of reports dealing with the quarterly benefit sanctions data released by DWP. The latest statistics were released on 16 August on Stat-Xplore at https://stat-xplore.dwp.gov.uk/webapi/jsf/login.xhtml, giving figures to March 2017. At https://www.gov.uk/government/collections/jobseekers-allowance-sanctions there is a summary spreadsheet Jobseeker’s Allowance, Employment and Support Allowance and Universal Credit sanctions: decisions made to March 2017 together with a Statistical Summary commenting on the figures, and various notes on publication strategy and methodology.
Since May 2017, Stat-Xplore has included sanctions on Universal Credit (UC) claimants back to August 2015 and on lone parent claimants of Income Support (IS) back to October 2016, as well as on Jobseekers Allowance (JSA) claimants back to April 2000 and on Employment and Support Allowance (ESA) claimants back to their inception in October 2008.
In the summary spreadsheet (but not on Stat-Xplore) there is new information on the duration of completed ESA and Universal Credit (but not JSA) sanctions, and on the number of ESA and UC claimants subject to sanction at a point in time. DWP has also added to Stat-Xplore the medical condition which is the principal reason for each ESA claim, using the International Classification of Diseases with 20 groups. This new information is discussed in this Briefing.
All statistics relate to Great Britain.
Groups of claimants exposed to sanctions: JSA, ESA, Universal Credit and Income Support
At February 2017, a total of over 1.6m claimants of JSA, ESA, Income Support or Universal Credit were exposed to sanctions.
Figures for all of the sanctionable groups are now starting to be affected by the gradual transfer of claimants from existing benefits to Universal Credit, although the only significant impact to date is on the unemployed.
Since 2013, DWP has been transferring new unemployed claimants of income-based (but not contribution-based) JSA on to Universal Credit. In July 2017 there were 773,435 unemployed claimants, of whom 452,353 (58.5%) were on JSA and 321,082 (41.5%) on UC.
Until May 2016, transfer was only of unemployed claimants without dependants. But since May 2016, under the ‘full service’ rollout, DWP has also been transferring to Universal Credit new claimants of all household types of all the types of benefit which are subsumed into Universal Credit. These are Housing Benefit (not relevant to sanctions), income-based (but not contribution-related) JSA, Working Tax Credit, Child Tax Credit, income-related (but not contribution-related) ESA, and Income Support. The ‘full service’ rollout was initially slow but by March 2017, 57 out of 714 Jobcentres were operating ‘full service’. This is 8% of the Jobcentres. Because only new claimants are currently transferred, far fewer than 8% of the claimants of each benefit other than JSA have so far been transferred. However, rollout is now accelerating. In July 2017, 104 Jobcentres were operating ‘full service’ and from October 2017 this will increase by some 50 per month. The full schedule is available at https://www.gov.uk/government/publications/universal-credit-transition-to-full-service
Figure 1 shows how the numbers of claimants on UC have increased, by conditionality regime. It shows that to date, the impact of transfers of people from benefits other than JSA and Working Tax Credit has been negligible.
Within ESA, only those in the Work Related Activity Group (WRAG) are subject to sanctions. Their number peaked at 562,620 in August 2013 but has been continuously declining since then and has now fallen to an estimated 407,000 in March 2017.
The number of lone parents on Income Support has also been falling, to 394,760 in February 2017. Currently, only those with a youngest child aged under 1 are exempt from sanctions. Some other IS claimants are also subject to sanctions.
In July 2017 there were 60,617 in-work UC claimants subject to sanctions in the DWP’s pilot areas (provisional figure). These are low paid or part-time workers who prior to UC would not have been subject to sanctions at all.
Universal Credit sanctions
The UC regime has similar lengths of sanction to those of JSA for the various ‘failures’, but there are some critical differences. Sanctions are lengthened by being made consecutive, not concurrent. Hardship payments become repayable. Given that repayments are made at the rate of 40% of benefit – the same as the amount by which a hardship payment is lower than the benefit – this means that for claimants receiving hardship payments, UC sanctions are in effect 2½ times as long as their nominal length. All sanctioned UC claimants must also demonstrate ‘compliance’ for 7 days before applying for hardship payments, and must reapply for each 4-week period. The 80% hardship rate for ‘vulnerable’ claimants is abolished. There are also some new ‘lowest’ categories of sanction (DWP 2017, pp. 3 & 9) although these currently account for only 6% of UC sanctions after challenges. The ESA sanction regime is similar but not identical to JSA but the IS regime is milder.
Sanctions before and after reviews, reconsiderations and appeals
The DWP’s Stat-Xplore database only shows sanctions after any reviews, reconsiderations and appeals that have taken place by the time the data are published. But numbers of sanctions before the results of these challenges are important since they show all the cases in which claimants have had their money stopped. Although a successful challenge should result in a refund, this is only after weeks or months by which time serious damage is often done. Estimates of sanctions before challenges are therefore given here but although reliable for longer time periods, they are not fully accurate for individual months. Figures for sanctions before challenges are currently higher than the ‘after challenge’ figures by about 20% for JSA and 40% for ESA. To date, under 5% of UC sanctions have been overturned following challenge and for lone parent IS sanctions only 1%, so for these types of sanction there is much less difference between the pre-and post-challenge figures. This Briefing has a mixture of pre- and post-challenge sanctions figures.
UK STATISTICS AUTHORITY CRITICISMS OF SANCTIONS STATISTICS
The May 2017 issue of this Briefing reported the UK Statistics Authority’s letter of 29 March 2017 to DWP which requested an update on the steps being taken to comply with the recommendations of the UKSA, Public Accounts Committee and National Audit Office on the sanctions statistics.
The DWP’s reply of 6 April, by Neil McIvor, Head of Profession for Statistics, leaves DWP far short of compliance with the requirements of the UKSA.
The best way to assess the position is to return to the five recommendations made by UKSA to DWP in its original letter of 5 August 2015. These are shown below, with a summary of the current position.
• Provide users with benefit sanction statistics based on the actual number of sanctions applied, making clear the numbers of reviews, reconsiderations and appeals. The key issue here is that the DWP statistics exclude sanctions which have been overturned on review, reconsideration or appeal by the time of publication of the statistics. As noted above, this results in the number of JSA sanctions being understated by about 20% and ESA sanctions by about 40%. Neil McIvor’s letter ignores this issue and deals only with the separate issue of ‘suspensions’ of JSA which do not lead to an actual sanction. The upshot is that DWP continues to ignore the UKSA’s requirement that it should tell the public how many actual sanctions there are before challenges. McIvor’s argument that suspensions are too few to be worth reporting is also spurious, since he has based it on data from a very untypical period. The suspensions issue is considered in the main body of the Briefing below.
• Make clear the limitations associated with the statistics. There have been some minor improvements to metadata and there seems now to be a greater willingness to publish methodological notes, but to date nothing has been done to prevent the major misrepresentations of the sanctions regime which characterise public debate.
• Include in the quarterly benefit statistics bulletin a statement of the proportion of JSA claims subject to a sanction, as well as the proportions of claimants who have been sanctioned during the most recent one-year and five-year periods, and the numbers on which these proportions are based. The DWP has now published figures showing the proportion of claimants serving a sanction at a point in time (although as noted below, their figures for Universal Credit are very misleading), and monthly sanction rates were already available. But nothing has been done to implement the more important recommendation to publish regularly the proportion of all claimants during a given period such as one or five years who are sanctioned. This is a much better guide to the likelihood of an individual claimant being sanctioned.
• Ensure all statements made using the official statistics are objective and impartial and appropriately apply the definitions of the variables underpinning the data, including ‘actively seeking work’. The major misrepresentation that JSA claimants sanctioned in relation to work search are described as ‘not actively seeking work’ when in almost all cases they are, has not been corrected.
• Extend the range of benefit sanction data available by addressing the gaps in information on repeat sanctions and hardship payments, alongside the development of sanction data from the Universal Credit system. In Annex B to his letter, McIvor says that ‘In response to user feedback we are currently investigating developing the statistics so we can report the number of repeat sanctions in a year.’ This is welcome but as such it would not address the problem that there is no information on the numbers of claimants subject to the lengthier sanctions imposed for repeat ‘failures’. This is because DWP does not record the date of each sanctioned ‘failure’ on its systems, and escalated sanctions are imposed for the commission of repeated ‘failures’ within a year. Hardship payment data were published for JSA and ESA in November 2015 but have not been updated. No hardship payment data have been published for Universal Credit.
There is an August 2017 update of the DWP sanctions statistics publication strategy at https://www.gov.uk/government/publications/benefit-sanction-statistics-publication-strategy
DWP CONSULTATION ON UNIVERSAL CREDIT STATISTICS
DWP is holding a consultation on future development of Universal Credit statistics. Details are at https://www.gov.uk/government/consultations/universal-credit-experimental-statistics-future-developments and the consultation closes on 24 October.
NUMBERS AND RATES OF SANCTIONS AGAINST UNEMPLOYED PEOPLE (JSA and Universal Credit)
In the year to March 2017 there were approximately 358,000 JSA or UC sanctions on unemployed people before challenges. This is an increase over the revised figure of 328,000 for calendar 2016. Of the 358,000 sanctions to March 2017, 129,000 were JSA and 229,000 UC. , Because UC sanctions have been growing fast, this understates the predominance now of UC sanctions: there are now more than three times as many of them each month as of JSA sanctions.
After challenges, in the year to March 2017 there were 105,041 JSA and 221,309 UC sanctions, a total of 326,350.
Figure 2 shows the monthly absolute numbers of JSA and UC sanctions since April 2000, showing UC sanctions overtaking JSA during 2016. Figure 3 shows the monthly sanction rates (sanctions as a percentage of claimants) for JSA alone and for all unemployed claimants since April 2000. This shows that the overall sanction rate on unemployed people has not fallen nearly as much as the DWP’s published figures for JSA have suggested. It did apparently fall to 3% during 2016 but by March 2017, while the JSA rate stood at about 2%, the overall rate was over 4.5%.
Figure 4 shows the monthly before-challenge sanction rates for JSA and for UC separately since August 2015, showing that while the JSA rate has fallen from about 3.5% to about 2.0%, the UC rate has fluctuated between 4% and 9.5%.
The reason for the big fall and then rise in UC sanctions between late 2015 and late 2016 appears to be the backlog in dealing with referrals mentioned by the National Audit Office (NAO 2016, para.2.26-27). The NAO said that DWP ‘expects to reduce the Universal Credit decision backlog to an acceptable level by December 2016’. Reducing the backlog with this timing would have the effect of increasing the monthly number of sanctions in the run-up to December 2016. The implication is that the rate of UC sanctions in recent months may be misleadingly high, but also that the rate in earlier months since late 2015 is misleadingly low. The best guide to the true rate of UC sanctions before challenges is therefore the average for the whole period August 2015 to March 2017, which was 7.4% per month. This is three times the rate of 2.5% for JSA over the same period. It makes the overall rate 3.8% for JSA and UC combined for these 20 months. At the moment it is impossible to say whether there is any trend in the UC monthly sanction rate before challenges, but the JSA rate has stabilised at about 2%. The overall rate of sanction on unemployed people is likely to rise simply because of the continuing transfer of claimants to the high-sanctioning UC.
Part of the explanation why the UC sanction rate is so much higher than JSA is that UC claimants tend to be younger, and younger people have a higher rate of sanction. But Figure 5 shows that for every age group, the mean monthly UC sanction rate after challenges since August 2015 is much higher than for JSA, by amounts varying from 58% to 122%. Figure 6 shows the individual monthly rates after challenges for each age group. Interestingly, the excess of the UC rate over the JSA rate is smallest for the 16-24 age group, in spite of this group having the highest sanction rate. As already noted, because of the administrative backlog, these figures probably overstate the UC sanction rate in the most recent months and understate it for earlier months.
The DWP (2017, p.4) states that under JSA, claimants not attending an interview will normally have their cases closed whereas under UC they are more often sanctioned. The reason for this is that UC claimants may be in receipt of other parts of UC, such as housing benefit and child credits, and therefore cannot have their cases closed. Figure 6 of the May 2017 Briefing showed that missed interviews are by far the most common reason for UC sanctions, so this could explain a lot of the difference between JSA and UC sanction rates, though not necessarily all.
The proportion of unemployed claimants who are sanctioned or who are under sanction at a point in time
The May 2017 Briefing gave updated figures on the proportion of JSA claimants who are sanctioned within a given time period. The NAO (2016, para.1.10 and Figure 5) showed that of all the people who claimed JSA at any time over the six years 2010 to 2015, no less than 24% were sanctioned before challenges. The proportion of all the JSA claimants in a given year who were sanctioned peaked at 17.99% in 2013/14 and was 8.15% in 2015/16.
The DWP’s summary spreadsheet at https://www.gov.uk/government/collections/jobseekers-allowance-sanctions has now provided figures for the proportion of all UC and ESA claimants who were under sanction at a point in time. It has not yet provided similar figures for JSA.
Figure 7 shows that to date, for unemployed and employed claimants taken together, the UC proportion has varied between 3.0% and 5.4% (as Figure 1 shows, this calculation is overwhelmingly dominated by unemployed claimants).
These figures are misleadingly low, for several reasons. First, DWP states in its methodological note (DWP 2017a, p.4) that in estimating this proportion it has included all UC claimants in the denominator, whether they are subject to conditionality or not. In fact, at March 2017 over 25% of UC claimants were not subject to sanctions at all. This means that the true proportions would be between 4.0% and 7.2% rather than 3.0% and 5.4%.
Second, for those receiving hardship payments, the true length of a UC sanction is two-and-a-half times the stated length, because the hardship payments have to be repaid. Therefore the proportion effectively under sanction is going to be much higher. How high we currently do not know as DWP has not published any data showing what proportion of sanctioned UC claimants get hardship payments. For JSA it is around 45% (see the November 2015 Briefing). If the UC hardship payment proportion is the same then the true proportion under sanction (including the denominator adjustment already made above) would be between 6.7% and 12.0%. Finally, the impact of a sanction often lasts long after it has formally ended, because the damage it does is difficult or impossible to repair. In relation to this latter consideration, the proportion of claimants sanctioned within a five or six year period is much more relevant.
The duration of Universal Credit sanctions
In the DWP’s summary spreadsheet there is also information on the duration of completed Universal Credit and ESA sanctions. The new figures do not cover JSA. This is unfortunate because people particularly want to know how many individuals have been subjected to the 3-year JSA sanctions introduced in 2012. DWP says that it intends to publish these figures later, but has not committed to a date.
The DWP’s figures show the actual duration of the sanctions completed in a given month, and they include sanctions overturned on reconsideration or appeal. So, for instance, a 13-week sanction which is overturned on reconsideration after 8 weeks, with payment of full benefit restarting after 9 weeks, will be shown as lasting 9 weeks. This is valuable, although on the other hand, as noted earlier, the figures do not include the very lengthy periods when claimants receiving hardship payments are suffering continued deductions due to repayment of the hardship payments.
The figures also currently need very careful interpretation due to the short time period they cover. They cover 17 months, but UC sanctions may last for up to 36 months. In other words, there are uncompleted sanctions excluded from the figures which when eventually included will increase the numbers of lengthy sanctions. Figure 8 illustrates this. It shows, for instance, that the proportion of UC sanctions shown as lasting under 4 weeks has fallen from over 60% to under 50%, while the proportion in the 14 to 26 week category has risen from under 3% to over 12% and in the 27+ weeks category from 0.39% to about 4%. The chart shows that the proportions in each category have not yet fully settled down. Therefore it is the most recent months which are the best guide to the true figures, although they will still be understating the true length of UC sanctions, and the picture will be complicated by the backlog issue discussed earlier.
The final complication is that, as noted earlier, the true length of a UC sanction is two and a half times its nominal length if the claimant is getting hardship payments. The DWP’s figures show the median UC sanction length currently standing at 31 days. If we allow for repayments of hardship payments on the same basis as above, the true median would be about 52 days, or over 7 weeks. This is put in perspective if it is recalled that the maximum length of an unemployment benefit disqualification for 73 years from 1913 to 1986 was 6 weeks, and actual lengths were usually much less.
JSA: SUSPENSIONS OF BENEFIT NOT FOLLOWED BY A SANCTION
Earlier issues of this Briefing have highlighted the fact that every month, thousands of JSA and ESA claimants have their benefits wrongly stopped as a result of sanctions which are subsequently overturned following challenge. But in addition to these cases, there are ‘suspensions’ of JSA where the claimant is suspected or accused of not meeting an ‘entitlement’ condition. These also often result in wrongful stoppages of benefit.
There are five ‘entitlement’ conditions: ‘actively seeking employment’ (ASE), availability, not having a Jobseeker’s Agreement, trade disputes and ‘joint claim exemption’. Of these, cases of ASE are by far the most frequent, with significant numbers in the availability category, while the other three are very rare. Where a claimant is suspected or accused of non-compliance with an ‘entitlement’ condition, their benefit is suspended immediately, in advance of a decision, on the ground of protecting public funds from unjustified disbursement. If the decision, when it is made, does not confirm the suspicion or accusation, then the claimant will in effect have suffered what is a sanction anyway in all but name, but it will not appear in any of the statistics. This problem grew enormously under the Coalition because of its aggressive use of the ‘actively seeking work’ basis for sanction.
The DWP’s letter to the UK Statistics Authority of 6 April 2017 (Annex A) points out that the number of abortive suspensions of JSA can be calculated from the data available on Stat-Xplore. All that is needed is to extract the number of ‘non-adverse’ and ‘cancelled’ cases in the five ‘entitlement’ categories.
Figure 9 shows the number of abortive JSA suspensions for all months since April 2000, showing that while there are now only a couple of hundred per month, at the height of the Coalition’s sanctions drive in 2013 they rose to a peak of 9,000 per month. Altogether, since the Conservatives came into office in May 2010 there have been 317,100 abortive JSA suspensions. Figure 10 shows that when the abortive JSA suspensions are added to the JSA sanctions overturned following challenge, they make a very substantial difference to the total of cases where claimants’ benefits are wrongfully stopped. At their peak in January 2013 they increased the total of wrongful stoppages of JSA by 82%.
In his letter to the UKSA, Neil McIvor of DWP argued that adding the total of abortive JSA suspensions to the total of JSA sanctions would make too little difference to be worth doing. But, as shown in Figure 11, he based his argument on the highly untypical period of October 2015 to September 2016. The chart shows that over much of the period since 2000, it would have made a very significant difference. In fact he is right to argue that simply adding abortive suspensions to the total of sanctions would be inappropriate, since suspensions are not sanctions. However, DWP should be showing the abortive suspensions separately in their summary spreadsheet and statistical summary, since they are a very real part of the damage being done by the sanctions system.
It should be noted that one of the main reasons why abortive suspensions have fallen since February 2013 is that the proportion of ‘not actively seeking work’ referrals resulting in an actual sanction had risen dramatically, from about 86% to about 96%. Thus it appears that to a major extent, wrongful suspensions have simply been replaced by wrongful sanctions. This issue was examined in the February 2016 issue of the Briefing.
It should be noted that the issue of abortive suspensions for ‘not actively seeking work’ does not arise under Universal Credit since under UC, work search is not an entitlement condition.
TAKE-UP OF INCOME-BASED JSA
Official statistics released on 14 September athttps://www.gov.uk/government/statistics/income-related-benefits-estimates-of-take-up-financial-year-201516 show that there has been a major fall in the take-up of income-based JSA since Conservative ministers took over in 2010 (Figure 12). In 2009/10 an estimated 69% of those entitled claimed JSA; by 2015/16 this had fallen to 56%. These figures do not show take-up of contribution-based JSA, which will almost certainly be lower because fewer of those entitled will badly need the money. A major objective of sanctions policy has been to drive people off benefit, and in this it has been successful. However another obvious point is that unless people claim JSA, they cannot participate in any government employment programmes. These programmes are therefore to a large extent failing before they start, since they can only reach just over half the target group. The August labour market report by the Learning and Work Institute at https://www2.learningandwork.org.uk/statistics/labour/august-2017 suggests that this failure is even greater in the case of unemployed young people, of whom only 44.8% (measured on a different basis) are claiming JSA or UC.
The take-up figures for income-based ESA/Income Support have not fallen in the same way and in fact there has been a slight rise since 2009/10. But only a minority of ESA claimants are subject to sanctions (17.3% at February 2017).
ESA SANCTIONS
The ESA sanction rate is stable (Figure 13). Over the year to March 2017, the rate of sanction on ESA claimants in the WRAG, before challenges, averaged 0.32% per month. The total of ESA sanctions in the year to March 2017 was approximately 16,500 before challenges and 12,046 after challenges. Almost 90% of ESA sanctions are for not taking part in work-related activity (Figure 14).
As explained in earlier Briefings, the upturn in ESA sanctions after challenges for ‘failure to participate in work related activity’ in the latest month is probably not significant, because some successful challenges have yet to show up in the figures.
The proportion of ESA claimants who are sanctioned or who are under sanction at a point in time
The only available figure for the proportion of all ESA claimants in a given year who were sanctioned is 2.9% for 2014-15 (see the February 2016 Briefing). The DWP’s summary spreadsheet now gives figures on the proportion of ESA claimants subject to sanction at a point in time. This shows that the proportion of ESA Work Related Activity Group claimants subject to a sanction rose from 0.14% in December 2012 to a peak of 1.09% in April 2014, before falling back to 0.57% in December 2016 (Figure 7). ESA hardship payments are not repayable and do not affect this calculation. However, the fact that the effects of sanctions are often very long-lived does affect the relevance of these figures. For many purposes, the 2.9% figure (and the figures for 5 and 6 year periods, currently unknown) will be more relevant.
Duration of ESA sanctions
Durations of ESA sanctions from the DWP’s summary spreadsheet are shown in Figure 15. These figures cover a much longer period than the UC figures – four years from December 2012 to December 2016. The most disturbing feature is the relatively high proportion of long duration sanctions. By the end of 2016, one quarter of completed ESA sanctions were lasting more than three months and 16% for more than six months. In particular, the proportion of sanctions lasting more than six months is far higher than for UC, at around 15%. This is quite extraordinary when it is considered that all of these ESA claimants were sick or disabled and officially considered unfit to work.
ESA sanctions by medical condition
Limited information on sanctions by medical condition has been published previously as a result of Freedom of Information requests. DWP has now added to Stat-Xplore the medical condition which is the principal reason for each ESA claim, using the International Classification of Diseases (ICD) with 20 groups.
In the following analysis, all data from before July 2011 have been ignored. This is because, as Figure 14 shows, the reasons for ESA sanctions were very different then from what they have been subsequently. Table 1 therefore shows the mean quarterly (not monthly) rate of sanctions after challenges for the period July 2011 to March 2017, for each of the 20 condition groups, ranking them in order from highest to lowest. It also shows the mean size of each group. The groups are of very different sizes, but the numbers are large enough to give a statistically reliable rate for all groups except ‘Perinatal’.
The variations between groups are very large. Of the big groups, ‘mental and behavioural’ has the highest rate of sanction, followed by ‘respiratory’, ‘injury and poisoning’, a general ‘other’ group, ‘nervous system’, ‘musculoskeletal’ and ‘circulatory’. The table shows particularly high sanction rates for investigations and procedures (what the ICD calls ‘Factors influencing Health Status and contact with Health Services’) and, disturbingly, for pregnant women.
Figure 16 shows the month-by-month changes in sanction rate for the six largest groups (excluding ‘other’). The most interesting finding here is that since mid-2015 the previous very large excess of the sanction rate for people with mental and behavioural conditions compared to other groups appears to have been eliminated. This suggests that DWP has made some progress in its treatment of people with these conditions. However the chart also shows that people with ‘injury and poisoning’ and ‘respiratory’ conditions have also had a consistently higher rate of sanction than other groups. There is no obvious explanation.
ANALYSES NOT INCLUDED IN THIS ISSUE
Income support sanctions, reasons for sanctions, and the working of the appeal system are not reported in this issue of the Briefing. They were covered in detail in the May 2017 issue and the analysis will be updated in future issues. A limited amount of information on UC in-work sanctions was reported in the May 2017 issue but no further information is available.
SANCTIONS – OTHER DEVELOPMENTS
Public Accounts Committee Inquiry on benefit sanctions
The government response to the PAC report of February 2017 was supposed to appear within two months, i.e. by 21 April, but has still not been published. When it does appear, it will be as a Treasury minute at https://www.gov.uk/government/collections/treasury-minutes.
UN Committee on the Rights of Persons with Disabilities
This UN Committee has criticised the UK government for failing to meet its obligations under the UN Convention on the Rights of Persons with Disabilities, in its Concluding observations on the initial report of the United Kingdom of Great Britain and Northern Ireland, 29 August. The report, which is otherwise hard to find on the web, is athttp://tbinternet.ohchr.org/_layouts/treatybodyexternal/Download.aspx?symbolno=CRPD%2fC%2fGBR%2fCO%2f1&Lang=en
The Committee specifically states (p.14) its concern about ‘The detrimental impact of the Employment and Support Allowance’s conditionality and sanctions on persons with disabilities and the limited access to reconsideration and repeal procedures’ and (p.15) calls on the government to ‘Conduct a review of the conditionality and sanction regimes concerning the Employment and Support Allowance, and tackle negative consequences on mental health and situation of persons with disabilities.’
The Daily Mirror at http://www.mirror.co.uk/news/politics/united-nations-says-treatment-disabled-11089365 reported the Committee chair as saying that the situation in Britain is a ‘human catastrophe’.
Upper Tribunal ruling: Time limits for Mandatory Reconsideration are unlawful
The Upper Tribunal has ruled that the DWP cannot prevent a claimant from appealing to a tribunal on the ground that their application for a Mandatory Reconsideration is late. There is a report in the Guardian at https://www.theguardian.com/society/2017/aug/04/uk-judges-rule-dwp-wrong-to-deny-appeals-over-refused-benefits and the decision itself JR/3861/2016 and CE/766/2016 is at https://assets.publishing.service.gov.uk/media/5983352ce5274a1704000066/CE_0766_2016-00.pdf
Chartered Institute of Personnel and Development reports that low skill jobs are hard to get
The CIPD reported on 14 August that there are currently 24 applicants for every low skill vacancy. It is thought that recent growth in labour supply may be responsible for this. A summary is at https://www.cipd.co.uk/about/media/press/140817-lmo-summer17and the full report is athttps://www.cipd.co.uk/knowledge/work/trends/labour-market-outlook
Bad jobs damage people’s health, and UK productivity
It is a doctrine of DWP ministers and officials that work is always good for you. For instance, the government response to the House of Commons Work and Pensions Committee report on Benefit Sanctions (2015) stated ‘There is a large body of evidence showing that work is good for physical and mental wellbeing’. An important new paper (Chandola & Zhang 2017) has added to the hard evidence showing that in many cases this is untrue. It found that ‘Formerly unemployed adults who transitioned into poor quality work had greater adverse levels of biomarkers compared with their peers who remained unemployed. …… Job quality cannot be disregarded from the employment success of the unemployed, and may have important implications for their health and well-being.’
The implications were discussed in an article ‘Britain’s joyless jobs market can be bad for your health’, by Sarah O’Connor, economics correspondent, in the Financial Times, 23 August. She specifically identified the role of benefit sanctions in driving people into these bad jobs, and pointed out that they are likely to worsen productivity as well as health. She commented ‘The hidden costs to the UK’s approach are becoming clearer’.
In line with this, the Financial Times reported on 6 July and 17 August that UK productivity has now fallen back to below its level of 2007. The Resolution Foundation published a report on 15 August (Clarke 2017) pointing out that the proportion of the population moving region and employer has declined by a quarter since 2000. Labour mobility is an important mechanism of labour market adjustment, and the report argues that the decline in mobility may be contributing to poor productivity growth as workers fail to find jobs that best suit their talents. Apart from pushing people into unsuitable jobs, sanctions also discourage labour mobility by penalising people who give up jobs; since 2012 these penalties have been made particularly severe, because for some reason the DWP views giving up a job as a more serious offence than other sanctionable ‘failures’.
The decline of local welfare schemes in England
From 2013, the government abolished Crisis Loans and Community Care Grants and devolved responsibility for emergency assistance to local authorities. The Centre for Responsible Credit has now carried out a desk exercise to find out what has happened to these local authority schemes in England, obtaining information about some 70% of schemes. The work was supplemented with 18 interviews with users. The study (Gibbons 2017) found that
• Twenty six local authorities have now closed their schemes altogether.
• A further forty one authorities have cut back spending on their schemes by over 60 percent
• Eleven of these have cut spending by over 80 percent and their schemes are now on the brink of collapse.
• The cut backs, combined with benefit delays, are creating destitution and are making it harder for people to live independently. The cuts are particularly affecting people with long-term illnesses or disabilities, young people leaving care, women fleeing domestic violence, people with prior experience of homelessness, and frail elderly people returning to their homes after a stay in hospital or who are struggling to remain independent and avoid going into care homes.
• There is a disproportionate impact on low income Black and Minority Ethnic communities.
• The cuts are counter-productive as a means of saving money as they are increasing the numbers of people needing higher cost interventions to help them with their deteriorating circumstances.
Scotland and Wales both operate national emergency welfare schemes. The first of what will be a regular annual series of review of the Scottish Welfare Fund by the Scottish Public Services Ombudsman is at https://www.spso.org.uk/scottishwelfarefund/sites/scottishwelfarefund/files/Documents/SWFAnnualReport2016-17.pdf
Who uses food banks and why? – report from the Trussell Trust network
This report (Loopstra & Lalor 2017), based on a well-structured sample of 413 food bank users in October to December 2016, found that over one third had suffered an income shock in the previous three months, benefit sanctions being the cause in 17% of these cases. Over 78% of user households were severely food insecure, meaning that they had skipped meals, gone without eating, or even gone days without eating in the past 12 months. For a majority of households this was a chronic experience, happening every month or almost every month over the past 12 months. Food bank users experience multiple forms of destitution. Half had gone without heating for more than four days in the past 12 months, and 1 in 5 had slept rough in the last 12 months.
Gibson et al.: Cochrane Review of effects of Welfare to Work on Lone Parents
This review (Gibson et al. 2017), based almost entirely on studies in the USA or Canada before 2000, found that Welfare to Work (WtW) interventions for lone parents do not have important effects on health. Employment and income were slightly higher 18 to 48 months after the start of the intervention, but there was little difference after 49 to 72 months. In a number of studies, lone parents who were not in WtW interventions found jobs by themselves over time. It is possible that effects on health were small because there was not much change in employment or income. Even when employment and income were higher for the lone parents in WtW, most participants continued to be poor. Perhaps because of this, depression also remained very high for lone parents whether they were in WtW or not.
The study is at http://onlinelibrary.wiley.com/doi/10.1002/14651858.CD009820.pub2/epdfand an abstract is athttp://onlinelibrary.wiley.com/doi/10.1002/14651858.CD009820.pub2/abstract
Special issue of the Journal of Poverty and Social Justice
The June 2017 number of the Journal is a special issue on Disability and Conditional Social Security Benefits. It is described in a blogpost by Ben Baumberg Geiger athttps://www.rethinkingincapacity.org/disabled-sanctions-research/and the same author has an article in the special issue comparing the approaches of different countries (Geiger 2017).
REFERENCES
Chandola, Tarani & Nan Zhang (2017) ‘Re-employment, job quality, health andallostatic load biomarkers: prospective evidence from the UK Household Longitudinal Study’, International Journal of Epidemiology, 1–11, doi: 10.1093/ije/dyx150
Clarke, Stephen (2017) Get A Move On? The decline in regional job-to-job moves and its impact on productivity and pay, Resolution Foundation, August, available at http://www.resolutionfoundation.org/publications/get-a-move-on-the-decline-in-regional-job-to-job-moves-and-its-impact-on-productivity-and-pay/
DWP (2017a) Benefit Sanctions Durations and Sanction rate calculation: Explanation of methodology, August, at https://www.gov.uk/government/publications/sanctions-durations-and-rate-background-information-and-methodology
DWP (2017b) Universal Credit Sanctions Experimental Official Statistics: Background information and methodology, August, athttps://www.gov.uk/government/uploads/system/uploads/attachment_data/file/637862/universal-credit-sanctions-statistics-background-information-and-methodology.pdf
Geiger, Ben Baumberg (2017) ‘Benefits conditionality for disabled people: stylised facts from a review of international evidence and practice’, Journal of Poverty and Social Justice, 25:2, 107–28
Gibbons, Damon (2017) The Decline of Crisis and Community Care Support in England: Why a new approach is needed, Centre for Responsible Credit, September, available athttps://www.responsible-credit.org.uk/decline-local-welfare-schemes/
Gibson, Marcia et al. (2017) Welfare-to-work interventions and their effects on the mental and physical health of lone parents and their children, Cochrane Database of Systematic Reviews, 20 August, available at http://onlinelibrary.wiley.com/doi/10.1002/14651858.CD009820.pub2/abstract
House of Commons Public Accounts Committee (2017) Benefit sanctions, Forty-second Report of Session 2016–17, HC 775, 21 February
House of Commons Work and Pensions Committee (2015) Benefit sanctions: Beyond the Oakley Review: Government Response to the Committee’s Fifth Report of Session 2014-15, HC 557, October, available at http://www.publications.parliament.uk/pa/cm201516/cmselect/cmworpen/557/557.pdf
Loopstra, Rachel & Doireann Lalor (2017) Financial insecurity, food insecurity, and disability: The profile of people receiving emergency food assistance from The Trussell Trust Foodbank Network in Britain, June, available at https://www.trusselltrust.org/wp-content/uploads/sites/2/2017/06/OU_Report_final_01_08_online.pdf
National Audit Office (2016) Benefit Sanctions, HC 628, 30 November
TABLE 1: ESA sanctions by principal medical condition, 2011-17
Condition category Mean number of claimants, July 2011 to March 2017 Mean quarterly rate of sanctions after challenges, July 2011 to March 2017 (sanctions as % of claimants)Investigations, procedures etc. 3932 2.82Pregnancy etc. 558 1.69Blood & immune system 755 1.31Digestive 6298 1.15Skin 2683 1.14Mental and behavioural 224985 1.13Respiratory 7700 0.92Injury, poisoning & external 21003 0.92Not elsewhere classified 43560 0.90Genito-urinary 3268 0.90Endocrine & metabolic 6312 0.81Nervous system 24871 0.75Infectious & parasitic 3349 0.72Musculoskeletal 75692 0.70Circulatory 15072 0.68Neoplasms 3746 0.62Eye 2924 0.54Ear 1567 0.53Congenital 605 0.07Perinatal 10 0.00
 figure 2


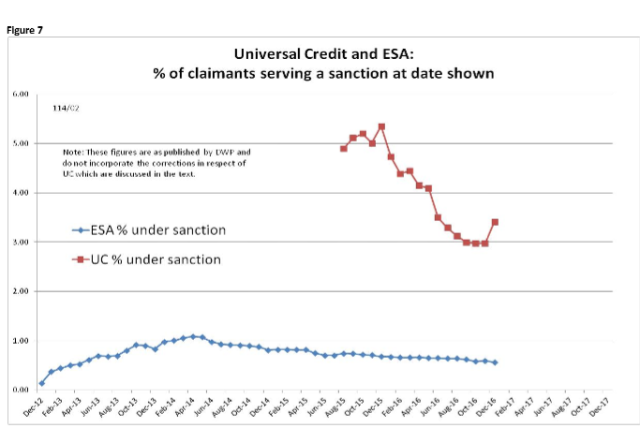


 Figure 11
 Figure 12
 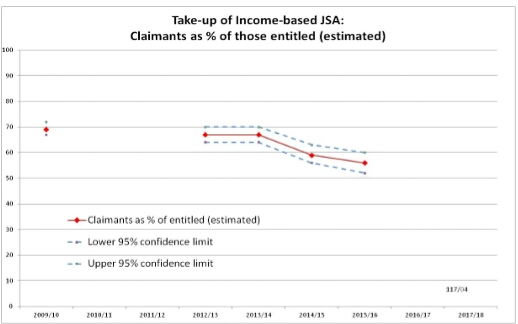 Figure 13
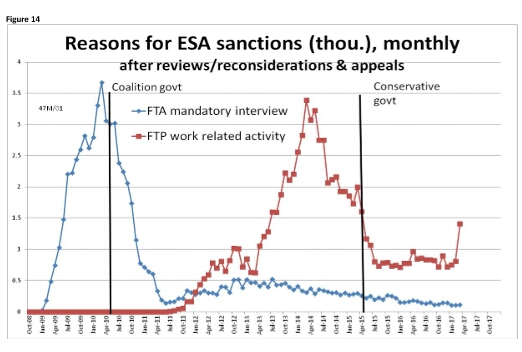
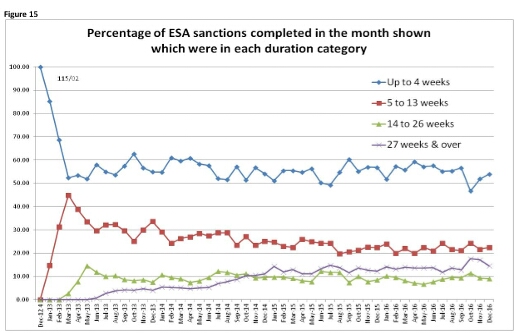 Figure 16

NOTES
Previous briefings are available at http://www.cpag.org.uk/david-webster. They include many analyses that remain valid. However it should be remembered that the DWP may have made subsequent revisions to the data reported in earlier briefings.
‘In-work’ conditionality has been taken to apply to claimants in the statistical category ‘working – with requirements’. Repayment is suspended for any month when the claimant earns more than their threshold, and any remaining debt is written off if the earnings threshold has been met for 26 weeks, whether continuous or not. The basic concept of the DWP’s sanctions database is that each sanction case appears only once, and is given its latest status and attributed to the month of the latest decision on the case. So, for instance, if a decision is made in January 2014 to sanction someone, this decision is reviewed in March 2014 with an outcome unfavourable to the claimant, reconsidered in a ‘mandatory reconsideration’ in May 2014 again with an unfavourable outcome, and is heard on appeal by a Tribunal in October 2014 with a decision favourable to the claimant, then:
• it appears in the statistics for the first time in January 2014 as an adverse ‘original’ decision
• in March 2014 it changes its status to a ‘reviewed’ adverse decision and moves month to be with all the other cases where the latest decision has been made in March 2014
• in May 2014 it changes its status to a ‘reconsidered’ adverse decision and moves month to be with all the other cases where the latest decision has been made in May 2014
• in October 2014 it changes its status again to an appealed non-adverse decision, and moves month again to be with all the other cases where the latest decision has been made in October 2014. https://www.statisticsauthority.gov.uk/wp-content/uploads/2017/03/Letter-from-Ed-Humpherson-to-Neil-McIvor-290317.pdf The DWP reply is at https://www.statisticsauthority.gov.uk/wp-content/uploads/2017/06/170608-Letter-to-Ed-Humperson-from-Neil-McIvor-Sanction.pdf. Unfortunately it was overlooked in the May 2017 Briefing. At https://www.statisticsauthority.gov.uk/wp-content/uploads/2015/11/letterfromedhumphersontodavidfraze_tcm97-44815.pdf This updates the assessment included in the May 2016 Briefing, pp.4-5. The UC sanction data published by DWP on Stat-Xplore include some sanctions on claimants other than unemployed but exclude sanctions in ‘full service’ areas . In the estimates given for total numbers of sanctions, these factors are assumed approximately to cancel each other out. In the estimates for UC sanction rates, approximate adjustments have been made for the missing ‘full service’ areas. The estimate of sanctions before challenges has been derived by adding the monthly total of ‘non-adverse’, ‘reserved’ and ‘cancelled’ decisions shown as being the result of reviews, mandatory reconsiderations and tribunal appeals, to the monthly total of adverse ‘original’ decisions. This produces only an approximate estimate for each individual month, since decisions altered following challenge are not attributed to the correct month. But the estimates are reliable for longer periods. Strictly speaking, the resulting figures do not show the number of abortive suspensions, but the number of cases where a suspension ought to have been applied under the DWP’s rules and where there was no subsequent adverse decision. But presumably there will be little difference between the two. The Learning and Work Institute take-up figures are derived by comparing the number of young claimants with the number of unemployed young people shown in the Annual Population (Labour Force) Survey, ignoring the distinction between income-based and contribution-based benefits. The total numbers of ESA sanctions completed each month shown in the DWP table are a large underestimate of the true figures. The DWP explains (DWP 2017a) that one fifth of sanction cases could not be included because of data matching problems; two or more sanctions served concurrently are often only counted once; some week-long sanctions are missing; and claims that have a sanction start date within a month of an off-flow from benefit are removed from the final dataset on quality grounds. These points do not invalidate the duration calculations, but they do mean that the figures on monthly completions of ESA sanctions cannot be used for any purpose. Quarterly rates have been used here because the number of claimants is only available for quarters, and quarterly figures smooth out some random variation.
